The 2026 World Cup Has 495 Hidden Brackets. Naturally, I Built a Simulator.
28 Jun 2026The 2026 World Cup is the first in history to field 48 teams. For most fans, that means more matches, more nations, more potential for upsets from smaller footballing countries. For a forecasting model, it means something more specific: a format so structurally novel that most existing simulators handle it incorrectly — and a genuinely interesting engineering problem worth solving from scratch.
When a sportsbook, analytics site, or forecasting model says a team has a 14% chance to win the World Cup, that number can feel more authoritative than it really is. It looks like a fact. It is not a fact. It is the output of a chain of assumptions: how strong each team is, how many goals they are expected to score, how often favorites lose, how tiebreakers are handled, and what kind of bracket path the tournament creates.
Most forecasting sites publish the number without explaining where it comes from. This is an attempt to open that up.
The first version of the project seemed straightforward enough. Load the fixtures. Give each team a strength rating. Simulate the remaining matches. Build the group tables. Advance the right teams. Repeat the tournament 10,000 times and count how often each country wins.
That is the basic idea behind Monte Carlo simulation. You do not try to predict the future once. You create thousands of plausible futures and ask what happens most often.
Then I got to the third-place teams.
The 2026 format expanded from 8 groups and 32 teams to 12 groups and 48 teams — the largest field in World Cup history. The top two from each group advance automatically, giving you 24 guaranteed qualifiers. The remaining eight spots in the Round of 32 go to the best third-place finishers across all twelve groups. This third-place mechanic is entirely new; no previous World Cup worked this way, which meant no simulator I could find handled it completely correctly.
That part is already unusual. But it is still not the hard part.
The hard part is that those eight third-place teams do not simply slide into the bracket wherever there is space. Depending on which eight groups produce qualifying third-place teams, those teams are assigned into specific knockout slots. There are 495 possible combinations.
Choose 8 qualifying third-place groups from 12 total groups

C(12, 8) = 12! / (8! × 4!) = 495
That one detail changed the whole project.
A team’s odds are not just a function of how good it is. They are also a function of where it finishes, which other third-place teams survive, what bracket slot that creates, and which opponents become possible several rounds later. The format itself becomes part of the model.
That was the moment the project stopped feeling like a simple standings calculator and started feeling like a real tournament simulator.
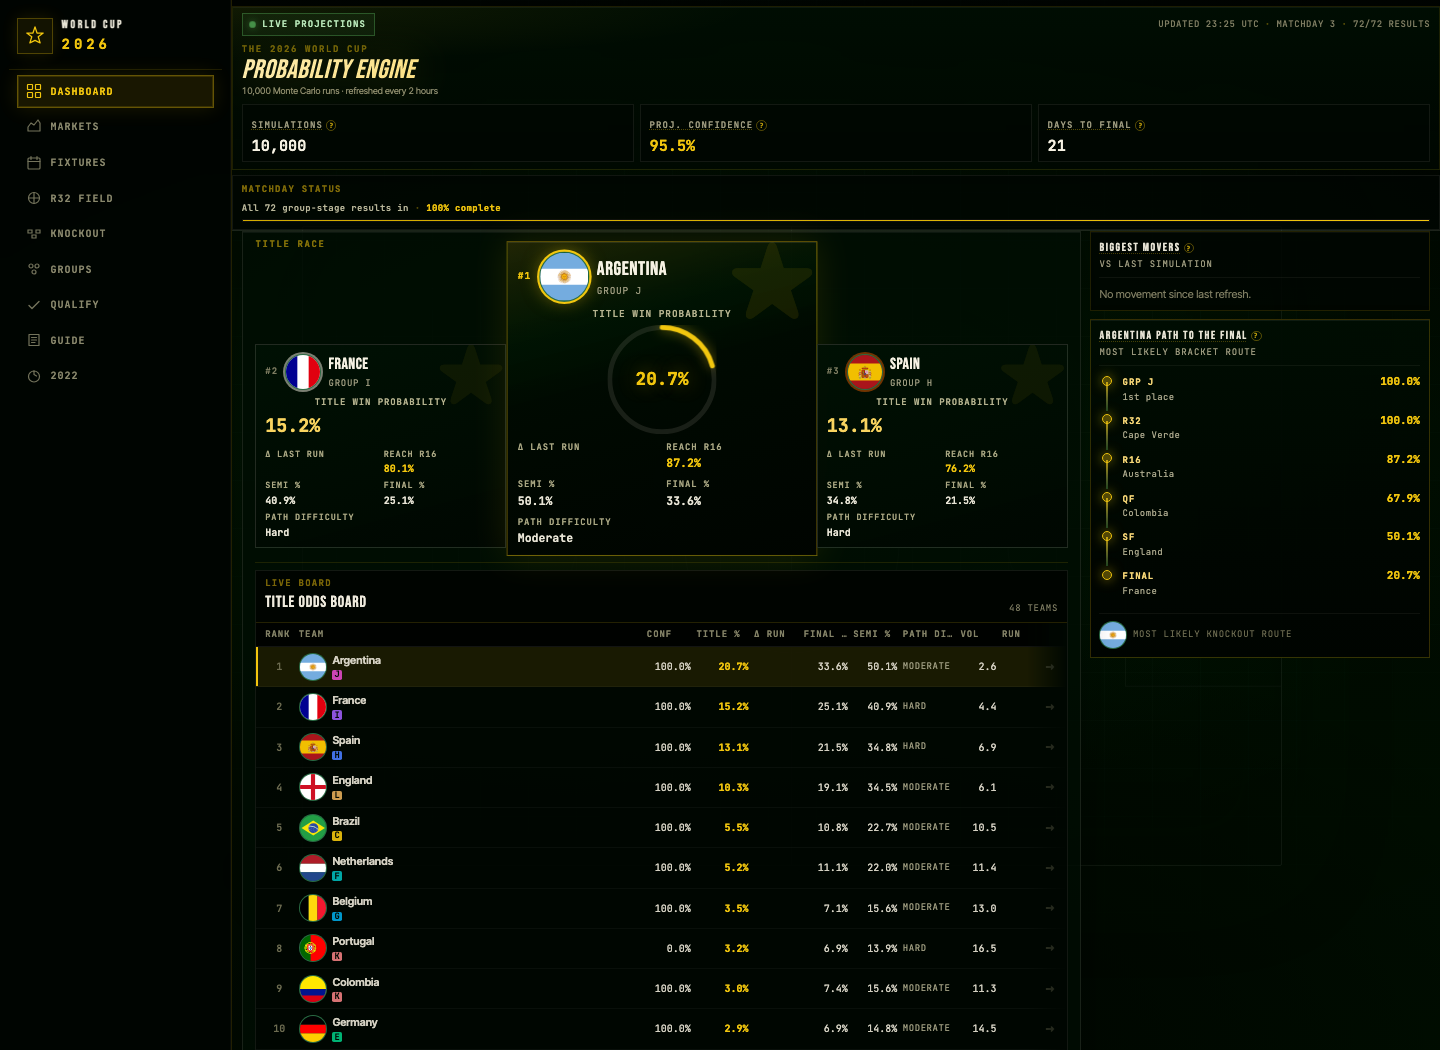 The live dashboard: 10,000 simulations per run, 95.5% projected confidence, 21 days to the final.
Odds Are Less Magical Than They Look
Sports odds often feel like they come from a black box. A betting app gives one team a price. A forecast gives another team a probability. The number looks precise, so people treat it as if it is objectively true.
But most of the time, a probability is just a compressed summary of many smaller modeling decisions.
How strong is each team? How many goals should we expect in a match between these two teams? How much randomness should football have? How often should a weaker team still win? What happens if two teams finish level on points? What does a draw do to the group table? What kind of path does a team face if it finishes first instead of second?
A model is a repeatable way to answer those questions over and over again. So when a simulator says a team has a 14% chance to win the World Cup, it does not mean the model knows what will happen. It means that, under that model’s assumptions, the team won about 14% of the simulated tournaments.
That distinction matters. The number is useful, but it is not prophecy. It is a structured argument about uncertainty — and in a tournament this size, with a format this new, the assumptions underneath that argument deserve more scrutiny than usual.
Simulating Matches Means Simulating Goals
The first practical problem was match simulation.
It would have been easy to give each team a simple win probability: Team A has a 60% chance to win, Team B has a 25% chance, and the draw is 15%. That can work in some contexts, but it is not enough for a World Cup group stage because scorelines matter.
A 1-0 win and a 4-0 win are not the same thing. Goal difference matters. Goals scored matter. Tiebreakers matter. If the model only knows who won, it cannot correctly build the group table.
So the simulator generates goals.
I used a Poisson goal model, which is a common starting point in football analytics because goals are discrete and relatively rare. The model estimates an expected number of goals for each team, then draws a scoreline from that distribution.
P(X = k) = (λ^k × e^-λ) / k!
Where X is goals scored, k is a specific count, and λ is the expected goals for that team in this match. If a team has an expected rate of 1.4, the model does not say “this team scores 1.4 goals.” It produces a probability distribution: 0 goals, 1 goal, 2 goals, 3 goals, and so on.
In code, the core of that is small:
home_goals = rng.poisson(home_expected_goals)
away_goals = rng.poisson(away_expected_goals)

if home_goals > away_goals:
    result = "home_win"
elif away_goals > home_goals:
    result = "away_win"
else:
    result = "draw"
The expected goals are derived from team strength ratings. In this version, the simulator uses an Elo-style post-match rating feed so team strength can update as tournament results come in. A team that dominates its group carries that signal into the knockout rounds. A team that scrapes through carries that signal too.
This is not a perfect football model. It does not know about injuries, tactical matchups, fatigue, suspensions, travel, or whether a striker is suddenly in the form of his life. But it creates a reasonable foundation: stronger teams score more often, weaker teams still win sometimes, and every simulated match produces an actual scoreline that flows into the tournament. The model does not just need to know who won. It needs to know how the result changes everything else.
The Rules Are Part of the Model
Once the simulator could generate scorelines, the next problem was making sure the tournament interpreted them correctly.
This is where a lot of casual predictors quietly go wrong.
A group table looks simple: sort by points, then goal difference, then goals scored. In many cases, that is enough. But when teams are tied, the model has to apply the correct tiebreaking sequence. Sometimes that means comparing the tied teams against the whole group. Sometimes it means isolating a mini-table among only the tied teams. Sometimes second and third are separated by a fallback nobody thinks about until it matters.
That sounds like an edge case until you run 10,000 tournaments.
Across twelve groups and thousands of simulations, ties happen constantly. Two teams tie on points. Three teams tie. Second and third are separated by goal difference. Third and fourth by goals scored. One small ranking mistake changes who qualifies, who gets eliminated, and who lands in which bracket slot.
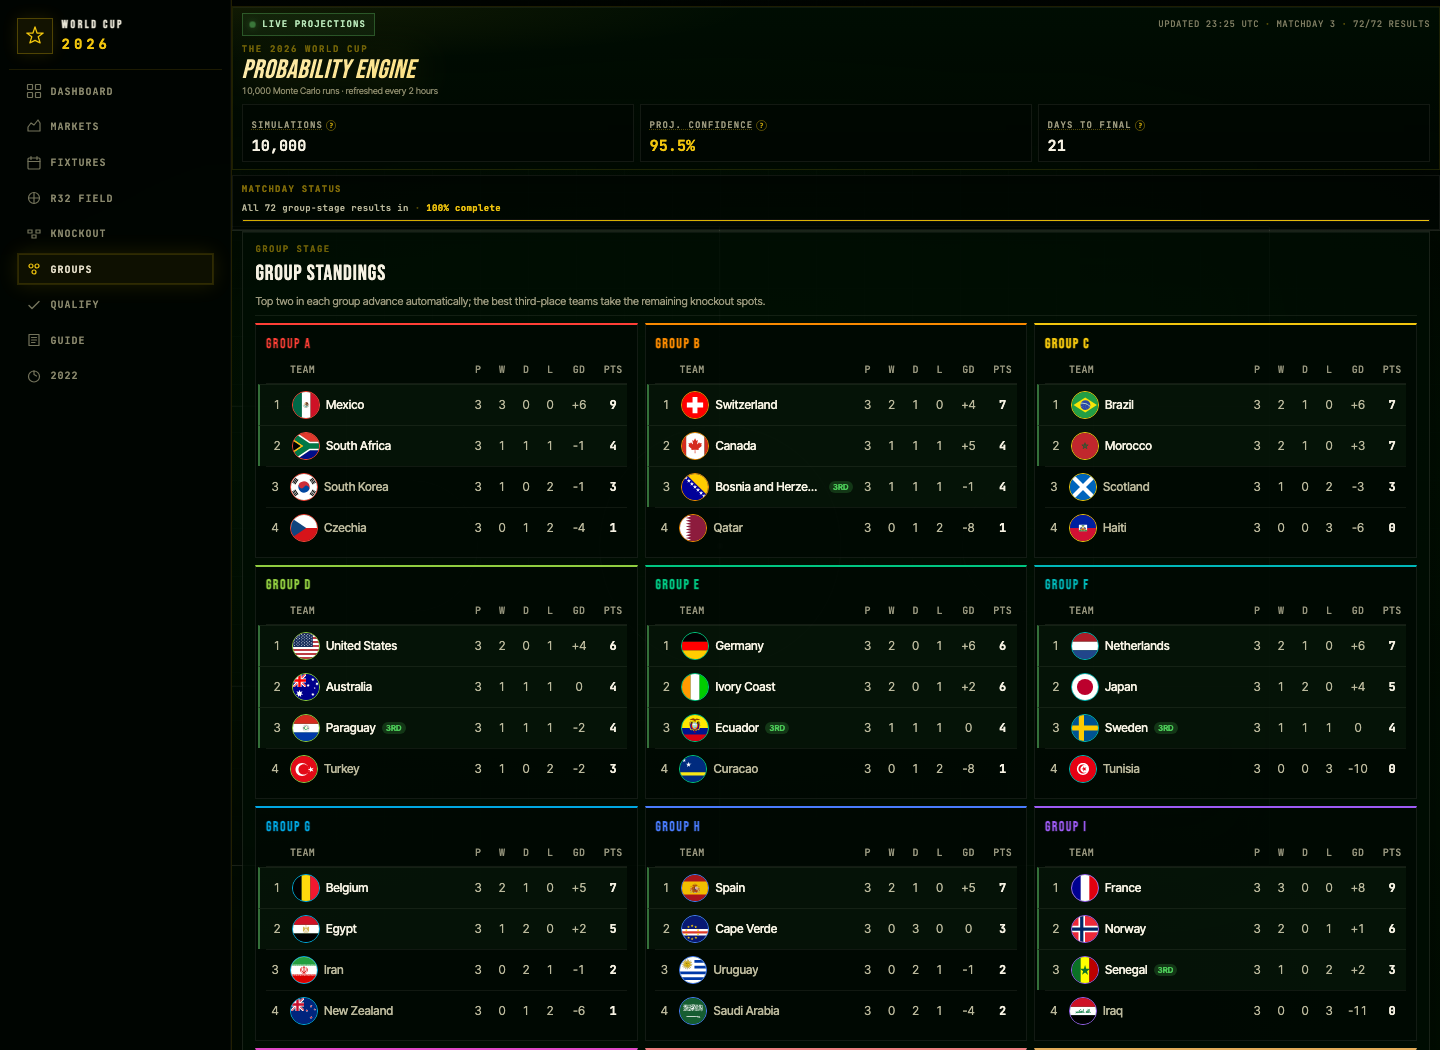 All 72 group-stage results in. Twelve groups, 48 teams, and dozens of tiebreaker scenarios that had to be handled exactly right.
That is one of the hidden lessons of building a simulator: rules are model risk. If the tiebreaker logic is wrong, the odds are wrong — not always in a way that jumps out visually. The bracket might still look plausible. The champion leaderboard might still look reasonable. But underneath, teams may be walking through paths that should never have existed.
So the backend owns the tournament rules. It calculates standings, applies the tiebreaker sequence, ranks third-place teams, maps the Round of 32, and exports the resulting tournament state. The frontend does not recalculate any of that. It renders the snapshot. That separation matters because a beautiful UI can still be structurally wrong.
The Bracket Is Not Just a Display Layer
After the group-stage logic was working, I expected the knockout bracket to be easy.
It was not.
The third-place qualifiers create the signature problem of the 2026 format. Twelve groups produce twelve third-place teams. Eight advance. Ranking them is straightforward enough — compare their group records and take the best eight.
But once you know which eight teams qualify, you still need to know where they go.
That is where the 495 combinations come in. Choosing eight qualifying third-place groups from twelve possible groups creates 495 possible group combinations. Each combination maps to a specific set of Round of 32 assignments. If the qualifying third-place teams come from Groups A, B, C, D, E, F, G, and H, they slot in one way. If they come from Groups A, B, C, D, E, F, G, and I, they may slot in another.
So the bracket is not just a display layer. It is part of the prediction model.
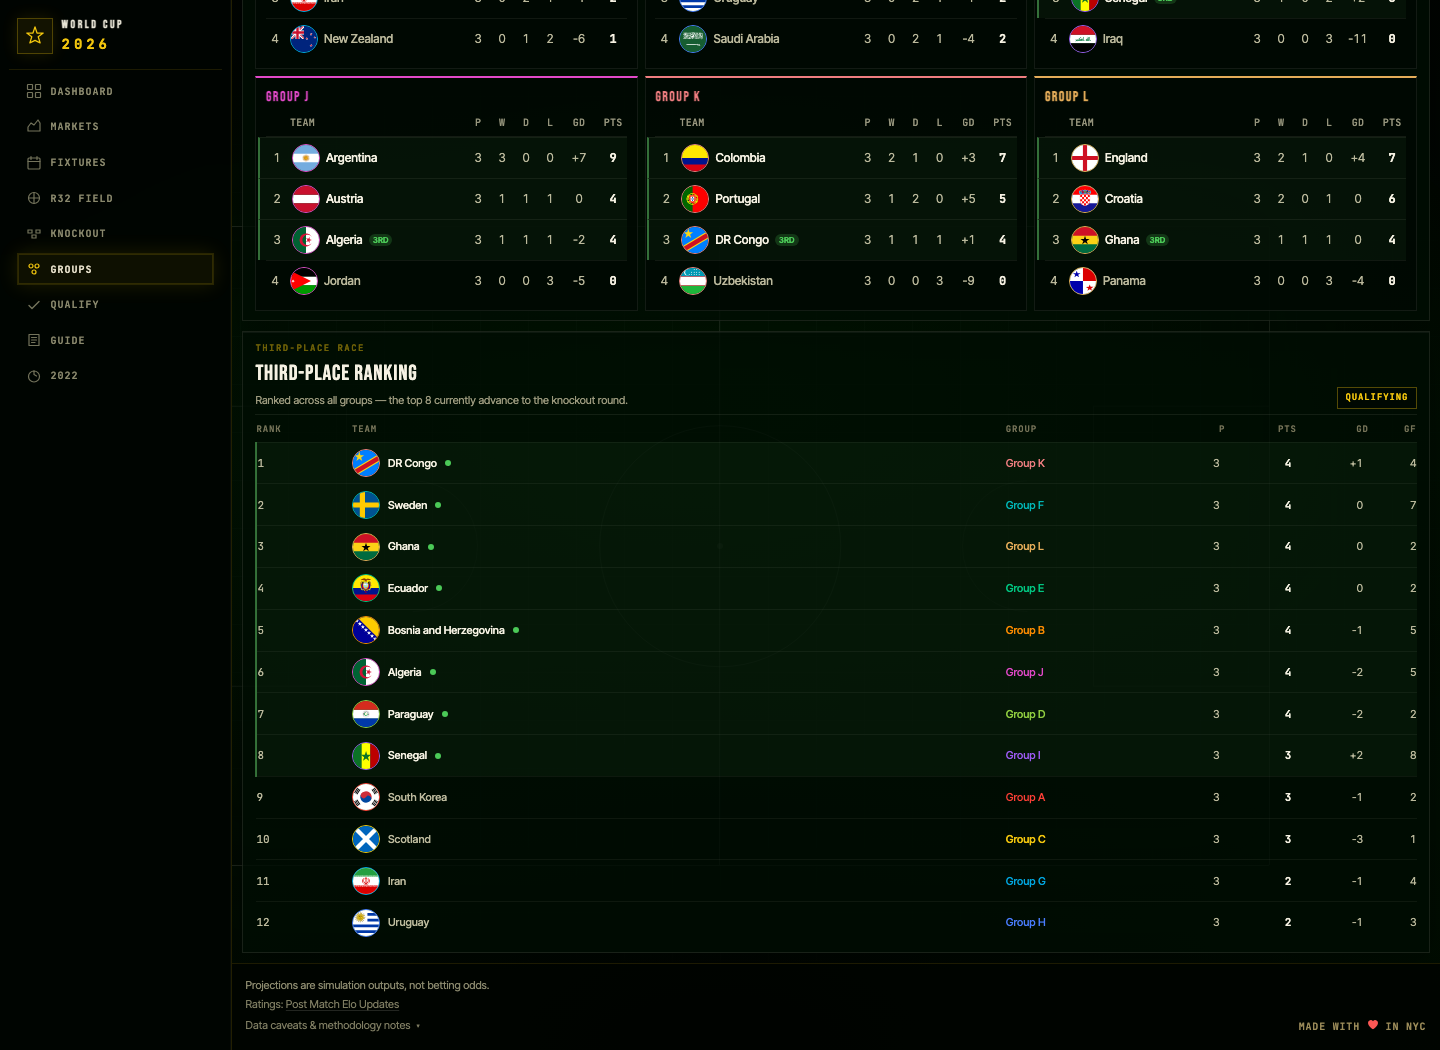 The third-place race. All 12 third-place teams ranked — the top 8 advance, but their bracket assignment depends on the specific group combination. DR Congo, Sweden, and Ghana leading the pack here.
The lookup looks simple enough in code:
qualifying_third_place_groups = ["A", "B", "C", "D", "E", "F", "G", "I"]
combination_key = "".join(sorted(qualifying_third_place_groups))

assignment = third_place_permutation_table[combination_key]
But that lookup is doing a lot of work. It prevents the simulator from inventing bracket paths that cannot exist. It turns a set of qualifying groups into the correct official assignment pattern. It makes sure the Round of 32 is structurally valid before any knockout simulations begin.
Without that step, a predictor can look right while being wrong. And a wrong bracket is not a cosmetic problem — it changes matchups, matchups change advancement probabilities, and advancement probabilities change champion odds. That was the most interesting technical problem in the project: the realization that the tournament structure itself had to be modeled as carefully as the teams.
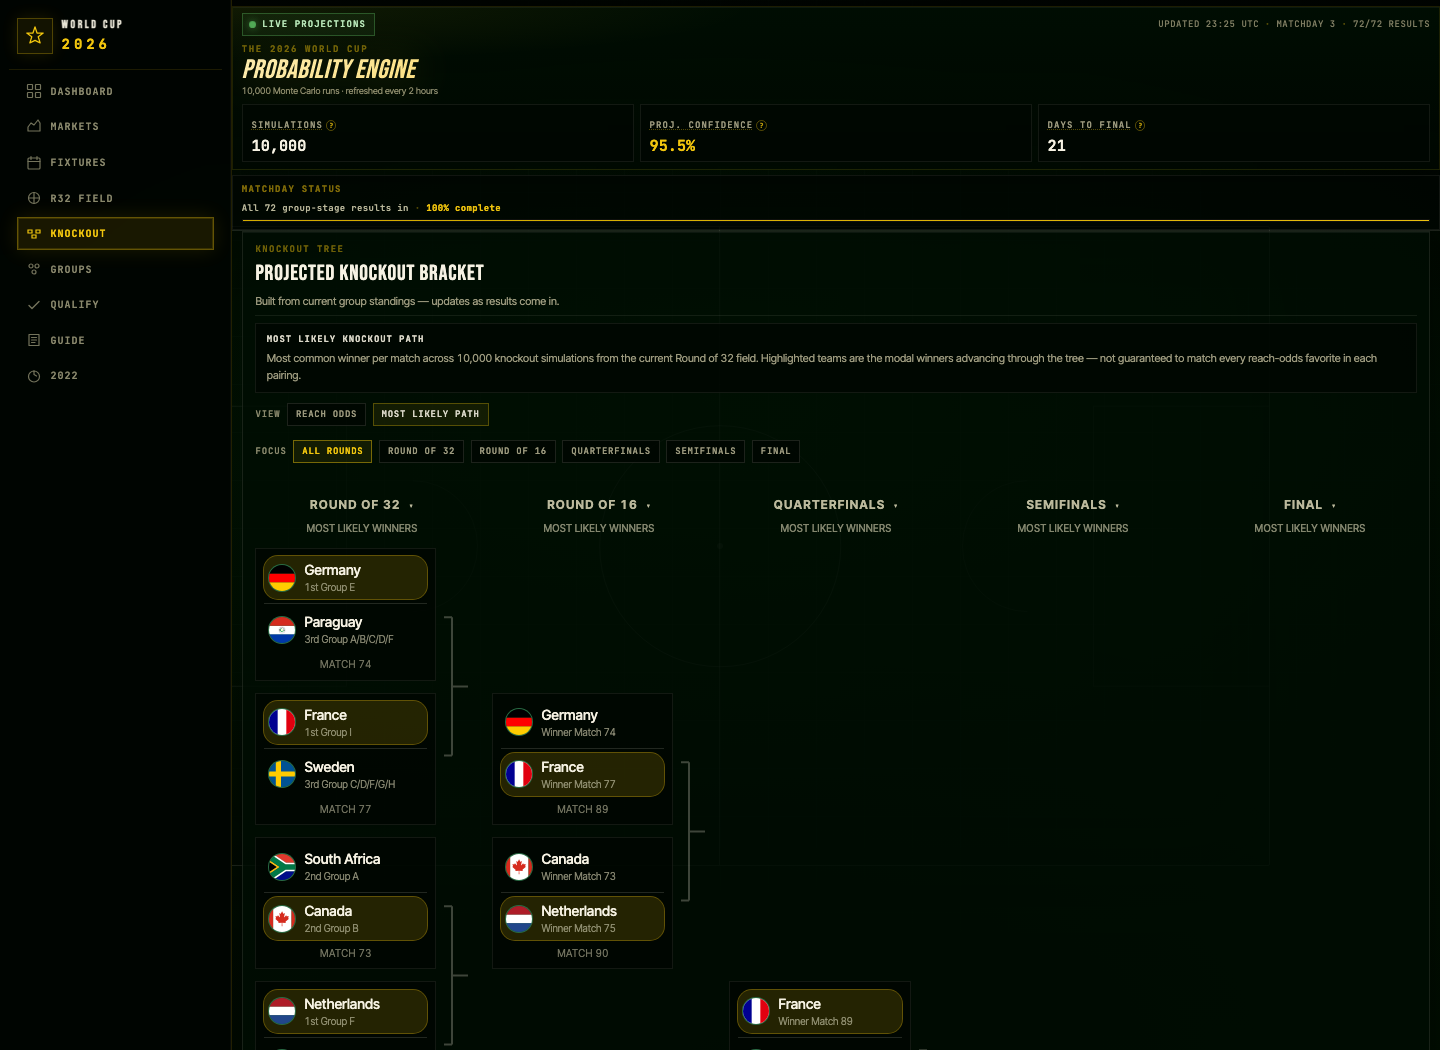 The “most likely path” bracket: Germany and France both looking dangerous on their side of the draw, with France emerging as the modal finalist from this portion of the bracket.
One Simulation Is a Story. Ten Thousand Become Odds.
A single simulated World Cup is fun, but it is not very useful.
In one run, Spain wins the tournament. In another, Argentina loses early. In another, Morocco makes a deep run. In another, the United States gets a favorable path. In another, a third-place team lands in a soft part of the bracket and suddenly has a real chance to reach the quarterfinals.
Any one simulation is just a story. The odds come from counting the stories.
champion_probability(team) =
    tournaments_won_by_team / total_simulated_tournaments
If Spain wins 1,240 out of 10,000 simulated tournaments, the model reports Spain at roughly 12.4% to win. In code:
champion_counts = Counter()

for _ in range(10_000):
    champion = simulate_tournament()
    champion_counts[champion] += 1

champion_probabilities = {
    team: wins / 10_000
    for team, wins in champion_counts.items()
}
I used 10,000 simulations as the working number because it was large enough to make the results fairly stable but still fast enough to rerun frequently. That runtime mattered more than I expected. A model that takes too long to run becomes something you avoid touching. A model that runs quickly becomes something you can update after each match, inspect, question, and improve.
That led to one of the more practical engineering decisions in the project. Early versions used pandas heavily, which made the code readable but too slow inside the simulation loop. Ranking one group table with pandas is fine. Ranking twelve groups across 10,000 simulated tournaments is something else entirely.
The hot path moved to plain Python dictionaries and lists. Less elegant, but much faster. That is another underrated part of building forecasting tools: the model has to be correct, but it also has to be usable.
What the Simulator Actually Shows
The obvious output is the champion leaderboard.
The strongest teams usually rise to the top, which is what you would expect. Argentina, France, Spain, England, Brazil, and the other elite programs should win more simulated tournaments than weaker teams. If they did not, something would probably be wrong with the model.
But the more interesting output is in the middle of the table.
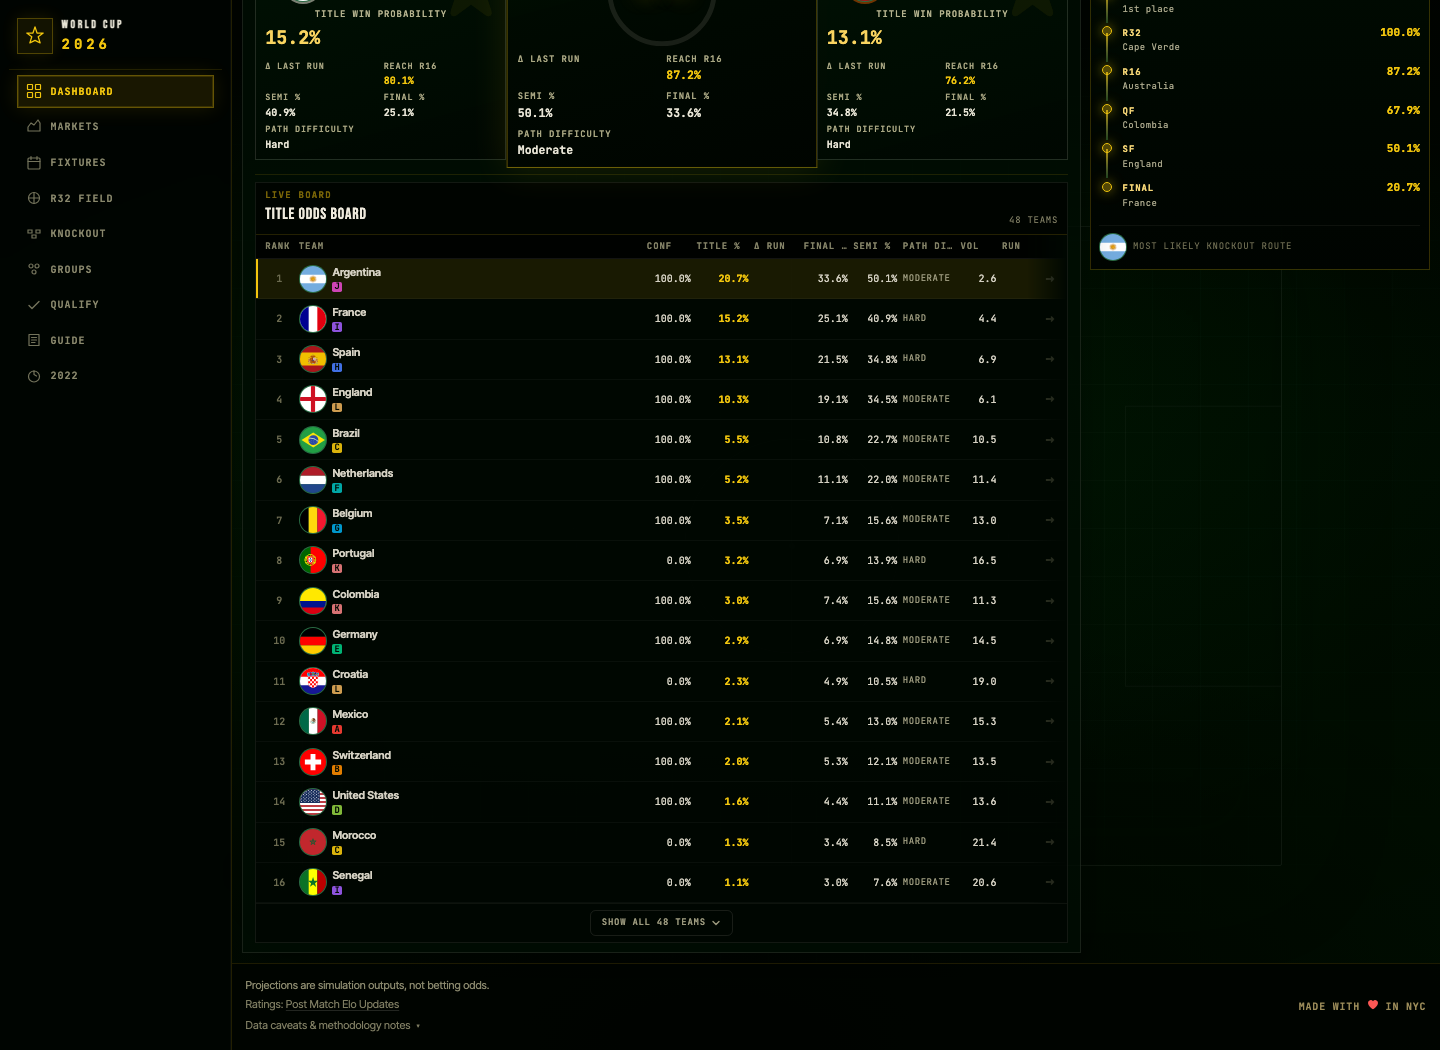 Argentina tops the model at 20.7% with a 50.1% semifinal rate. France sits at 15.2%. The gap between title favorite and deep runner is smaller than sportsbook prices often suggest.
That is where you see the difference between unlikely and impossible. A team may not be a favorite to win the World Cup, but it may still have a realistic path to the quarterfinals or semifinals. That path can come from team quality, but it can also come from tournament structure. Finish first instead of second and your opponent changes. Qualify as a third-place team and your assignment depends on the other third-place groups. Benefit from one upset elsewhere and a hard bracket can suddenly soften.
Fans tend to think in binaries: contender or not, good draw or bad draw, easy group or hard group. A simulator shows the gradient.
It also explains why odds move so much during a tournament. A result does not only affect the two teams on the field. It changes standings, tiebreakers, possible opponents, bracket slots, and the distribution of future outcomes. One match can move a team’s odds even if that team did not play. That is the part I find most interesting — the model is not just ranking teams. It is showing how the tournament creates and destroys opportunity in real time.
Model Outputs Are Not Facts
The biggest lesson from building this is that odds are not magic and they are not certainty.
They are structured arguments about uncertainty.
A model starts with assumptions: team strength, expected goals, randomness, tournament rules, simulation volume, and data freshness. Change the assumptions and the probabilities move. Use a different rating source and champion odds shift. Calibrate expected goals differently and upset rates shift. Apply the wrong tiebreaker and bracket paths shift. Ignore the third-place assignment table and the knockout stage can become structurally invalid.
That is why probabilities should be read as model outputs, not facts. “Team X has a 12% chance” really means “given this model’s inputs and assumptions, Team X won 12% of the simulated tournaments.” Useful. Not truth.
It is also different from a sportsbook price. A sportsbook price reflects market behavior, bookmaker margin, liability management, and how bettors are positioning. This simulator is not trying to replicate that. It is trying to produce a clean model-side probability: if these teams are this strong, and goals behave roughly like this, and the tournament follows these rules, what happens across thousands of possible World Cups?
Once you see odds that way, they become less mysterious and more debatable. You can challenge the inputs. You can improve the calibration. You can add injuries, suspensions, market prices, travel, or tactical information. But the basic machinery is understandable: estimate match outcomes, apply the rules, repeat many times, count the results.
The mystery is not where the number comes from. The mystery is which assumptions are good enough.
What the Model Gets Wrong
No model survives contact with a real tournament unchanged.
The goal model has not been formally calibrated against decades of international results. The current rating-to-goal conversion is intentionally simple. A better version would fit historical matches and estimate how rating differences translate into expected goals, draw rates, and upset probabilities with more precision.
Fair-play tiebreaking is a known gap. The code has a place for disciplinary data, but automatically sourcing and maintaining it is harder than it sounds. It probably will not decide who advances — until one day it does, and then it will matter completely.
The model also cannot see everything a human analyst would care about. Injuries, fatigue, tactical matchups, squad rotation, suspensions, and form are mostly outside the rating number. One missing center back or one suspended striker can change a match more than any rating gap suggests.
That is not a reason to avoid modeling. It is a reason to be honest about what the model is and is not saying. The uncertainty is not a failure of the math. It is built into the problem. Every extra assumption makes the model more realistic in one way and more fragile in another. Somewhere in that tradeoff is every forecasting product that has ever existed.
The Dashboard
The dashboard is live at wcpredict-2026.vercel.app.
It includes champion odds, the knockout bracket, group standings, third-place rankings, round-by-round advancement probabilities, team detail views, and a market comparison that puts the model’s probabilities next to current sportsbook prices.
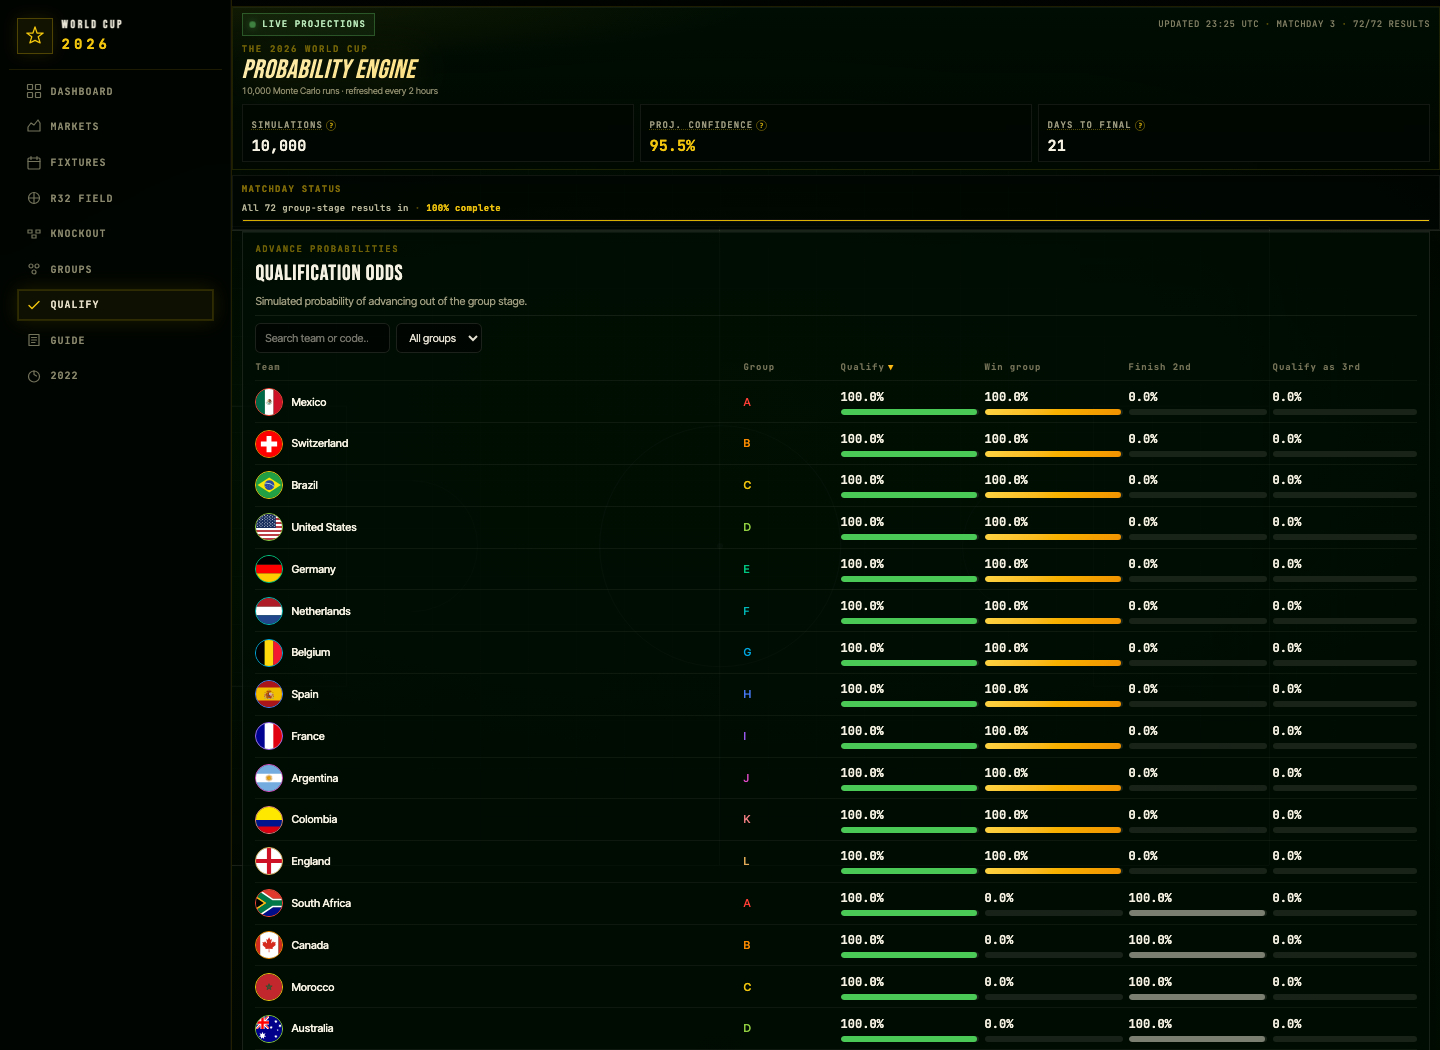 Qualification odds: the top teams locked in at 100%, but further down the list the bar charts tell a much more interesting story about who is actually safe and who is on the bubble.
The backend exports a complete JSON snapshot for the frontend on every update cycle:
{
  "metadata": {
    "generated_at": "2026-06-28T...",
    "ratings_source": "post_match_elo_updates",
    "simulations": {
      "group": 10000,
      "tournament": 10000,
      "round": 10000
    }
  },
  "standings": [],
  "third_place": [],
  "projected_qualifiers": [],
  "bracket": {
    "round_of_32": [],
    "round_of_16": [],
    "quarterfinals": [],
    "semifinals": [],
    "final": []
  },
  "odds": {
    "qualification": [],
    "round": []
  }
}
Python owns the tournament logic. The frontend owns the experience. That architecture is intentional — the hard part is not drawing a bracket. The hard part is making sure the bracket is valid.
I built this because the 2026 format is genuinely new territory, and the problems it creates deserve to be solved properly rather than papered over. The math inside a tournament simulator is actually fairly compact. The interesting part is everything surrounding it: the rules, the edge cases, the tiebreakers that fire in 1% of simulations but still matter, the 495 third-place combinations that nobody bothered to model before this year, and the assumptions that turn a 48-team tournament into a probability distribution.
The World Cup only happens once every four years.
The simulator plays it out ten thousand times.
Somewhere between those two things is the part that makes sports prediction worth thinking about.