Peeking into Every Possible Future: A Narrative on Monte Carlo Simulation
23 Sep 2025Peeking into Every Possible Future
Have you ever wondered what it would be like to peek into every possible
future?
I certainly have, especially when a beautifully
crafted customer plan unraveled within just days of launch.
Consider this scenario. Suppose you’re planning a six‑week leadership academy or intensive university course. Your promise to students is firm: everything wraps on time so they can return to their normal schedules without disruption. You map every session, assignment, and project with precision. Yet small uncertainties loom. A single lively debate might stretch a module by two days. A holiday could unexpectedly shrink a week of instruction. An instructor might face last-minute travel delays. Each of these alone seems minor, but together they threaten the entire calendar. This is where the ability to “peek into every possible future” would be invaluable.
It always starts out so well: calendars aligned, milestones locked in, tasks broken down into neat timelines. But reality has a way of throwing curveballs:
- Maybe a key reviewer calls in sick.
- Maybe a lively discussion doubles the time on an early module.
- Maybe an unexpected holiday cuts a week short.
Before long, you’re reacting instead of leading—sending “revised schedule” emails and hoping this version sticks. It’s frustrating, and it happens more often than most of us care to admit.
Here’s a thought experiment I love to run with teams:\
What if you could run the future a thousand times today, watch every
possible timeline unfold, and choose dates based on that full view
instead of a single guess?
Enter the Monte Carlo simulation—a technique that lets you stress-test your schedule before a single kickoff call or finalized syllabus.
From the Casino to the Command Center
The term Monte Carlo comes from the famous gambling district in Monaco. In the 1940s, scientists working on complex physics problems faced an impossible task: calculating every microscopic interaction in systems full of randomness. Their solution? Treat the system like a giant game of chance. Instead of one calculation, they rolled the dice thousands of times, letting the data reveal the most likely outcomes.
That same logic applies perfectly to planning any initiative where duration varies. Courses. Product launches. Enterprise change programs. Anything with people, tasks, and time.
Why Averages Fail Us
Most plans are built on averages. We say things like:
“Module A should take seven days.”
“Peer review averages three.”
But an average is a thin slice of the truth. A single delay in Module A can ripple forward and knock every later date off course. Padding the schedule with generic buffers helps, but it’s still guesswork.
Monte Carlo simulations replace those single numbers with ranges and then models thousands of possible futures. Instead of asking, “What date should we put on the calendar?” you ask, “How likely is it we’ll be done by June 10?” That is a subtle but profound shift.
Walking Through an Example
Building on the leadership academy scenario, let’s sketch out a Monte
Carlo run.
You identify seven key activities: orientation, two core modules, two
team projects, a guest lecture, and final presentations.
For each, you capture three numbers: best case, most likely, and worst case: Orientation might run anywhere from one to three days. A major project might take five on a good run or nine if the team hits a snag.
Next, you feed these ranges into a simple program—Python, Excel, or Power BI will do. The computer randomly selects a duration for each activity, one complete timeline at a time. Then it repeats the process 20,000 times.
What comes back isn’t a single end date. It’s a distribution. You might discover:
- 60 % chance of finishing within six weeks
- 90 % chance within seven
- 98 % chance within eight
Suddenly, you have more than a date—you have odds you can explain and defend.
See It in Action—Live Files Included
To make this tangible, I’ve published everything you need to experiment right now:
-
Chart of results (PNG) – View or download
- Activities template (CSV) – Download
- Simulation totals (CSV) – Download
These files came from my own run of a seven-activity course plan.
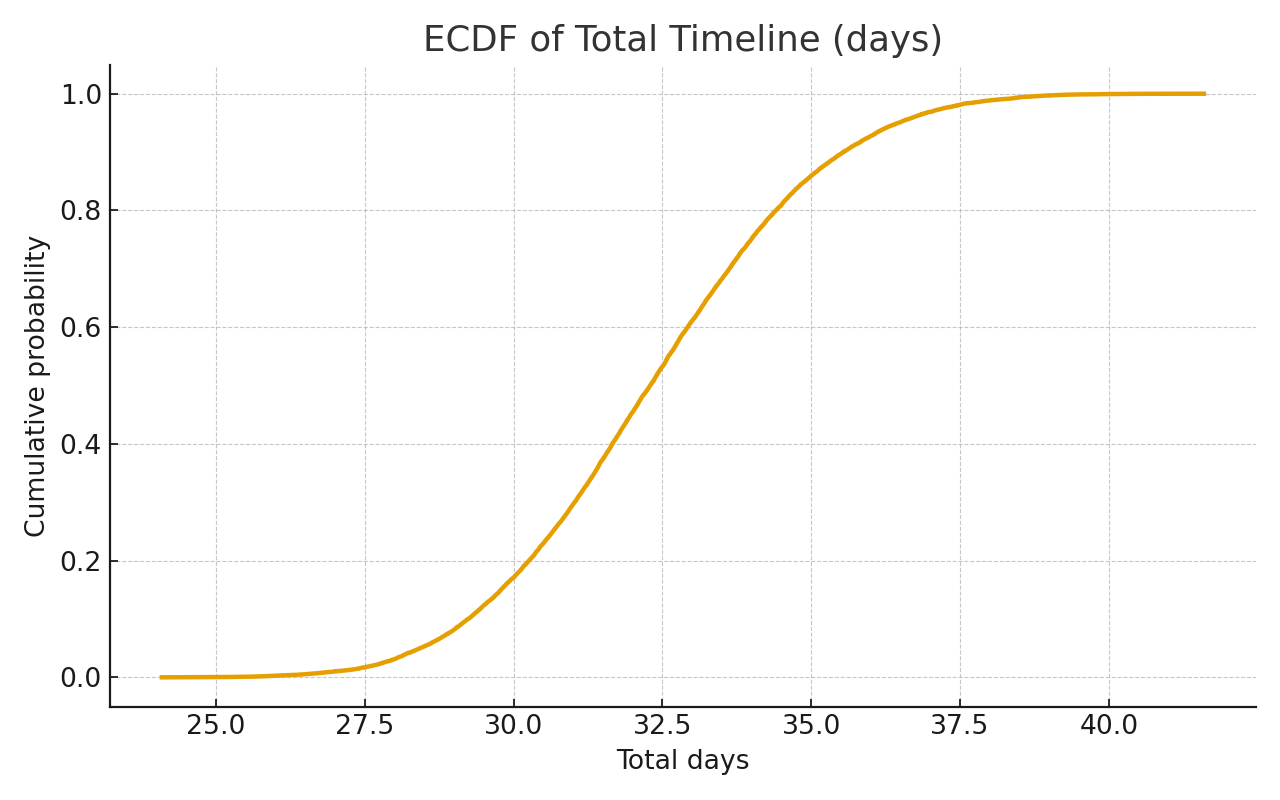
The chart shows the ECDF—an elegant way to read “by what date will
X % of simulations be complete?”
If you code, drop the snippet below into a notebook and watch the math unfold:
import numpy as np, pandas as pd, matplotlib.pyplot as plt


# Load the activity template from the local assets directory
activities = pd.read_csv('../assets/monte-carlo/course_activities_template.csv')

rng = np.random.default_rng(42)
draws = {row.activity: rng.triangular(row.best, row.likely, row.worst, size=20_000)
         for row in activities.itertuples()}
samples_df = pd.DataFrame(draws)
total_days = samples_df.sum(axis=1)

print("Median (P50):", np.percentile(total_days, 50))
print("80th percentile (P80):", np.percentile(total_days, 80))
print("90th percentile (P90):", np.percentile(total_days, 90))

# Probability of finishing in <=7 weeks (49 days)
print("Probability <= 49 days:", (total_days <= 49).mean())

# Quick ECDF plot
xs = np.sort(total_days)
ys = np.arange(1, len(xs)+1) / len(xs)
plt.plot(xs, ys)
plt.title("ECDF of Total Timeline (days)")
plt.xlabel("Total days"); plt.ylabel("Cumulative probability")
plt.show()
(be sure to download the file and update your relative path)
Reading the Curves and Tables
The ECDF curve gives you a fingertip feel for risk:
Pick a date on the x-axis, read the y-axis to see the chance of
finishing by then.
Percentiles like P80 or P90 become natural commitments—dates you can share with leadership or customers knowing you’ve quantified the odds. Meanwhile, the sensitivity analysis in the CSV shows which steps drive the most schedule risk, pointing you toward where to add buffers or rethink your schedule’s design.
Beyond Education
Although I framed this with a course example, the logic holds anywhere schedules can slip:
- Product launches with supply-chain volatility
- Corporate onboarding that depends on busy managers
- Marketing campaigns with interdependent creative assets
- Construction and infrastructure projects with weather exposure
If it has sequential tasks and uncertainty, Monte Carlo gives you an x-ray of risk.
No-Code Path for MSFT users/teams
Prefer to stay in a business intelligence tool? Power BI can import the same CSVs. You can create a simple measure:
OnTime% :=
  VAR tgt = SELECTEDVALUE(Targets[Days],49)
  RETURN DIVIDE(
    CALCULATE(COUNTROWS('Totals'),'Totals'[total_days]<=tgt),
    COUNTROWS('Totals')
  )
Add a slider to adjust the target date and watch the on-time probability update in real time.
Why I Keep Coming Back to This
Every time I build a new program or consult on a complex rollout, I remember that fragile feeling when a plan slips on Day 2. Monte Carlo doesn’t remove uncertainty—it embraces it, showing its contours so we can design with honesty and calm. Run the future a thousand times today. Then pick dates that will still make sense tomorrow.
Any questions or comments please feel free to ask below.
If an AI agent to run these simulations for you would be helpful to your team or you team, please reach out to me or my colleauges; this is something we’re currently working on